Gann Ultimate Time-Price Squares Method V 1.0This Script is an outcome of my Passion towards Gann Theory and his Methodology towards Trading.
The Script is still Evolving.So wait for more updates....
# Complete Trading Guide: Gann Time-Price Squares Indicator
## 🎯 Core Trading Philosophy
**Gann's Key Principle**: "When time and price come together, a change in trend occurs."
Your indicator identifies these critical moments where **Time = Price**, creating high-probability trading opportunities.
---
## 📊 Setup & Configuration
### Recommended Settings by Timeframe
| Timeframe | Pivot Lookback | Min Price Move | Tolerance | Use Case |
|-----------|---------------|----------------|-----------|----------|
| **1-5 min** | 5-8 bars | 0.5-1.0 | 1.0-2.0 | Scalping |
| **15-30 min** | 8-12 bars | 1.0-3.0 | 1.5-2.5 | Day Trading |
| **1-4 hour** | 10-15 bars | 2.0-5.0 | 2.0-3.0 | Swing Trading |
| **Daily** | 15-25 bars | 5.0-20.0 | 3.0-5.0 | Position Trading |
### Initial Setup Steps
1. **Add indicator** to your chart
2. **Set lookback period** based on your timeframe
3. **Adjust tolerance** - start with 2.0 and fine-tune
4. **Enable all visualizations** initially
5. **Position info table** where it doesn't block price action
---
## 🚀 Trading Strategies
### Strategy 1: Square Completion Reversal Trading
#### **Long Entry Setup**
```
CONDITIONS:
✅ Bullish square completes (green box appears)
✅ Info table shows "✅ COMPLETED" status
✅ Price bounces off square's bottom edge
✅ Volume increases on bounce
✅ RSI < 30 (oversold confirmation)
ENTRY: Market buy when price breaks above square's top edge
STOP: Below square's bottom edge (-2 ATR)
TARGET: Next resistance level or 1:2 Risk/Reward
```
#### **Short Entry Setup**
```
CONDITIONS:
✅ Bearish square completes (red box appears)
✅ Info table shows "✅ COMPLETED" status
✅ Price rejects square's top edge
✅ Volume increases on rejection
✅ RSI > 70 (overbought confirmation)
ENTRY: Market sell when price breaks below square's bottom edge
STOP: Above square's top edge (+2 ATR)
TARGET: Next support level or 1:2 Risk/Reward
```
### Strategy 2: Gann Angle Trend Following
#### **1x1 Angle (45°) - The Master Angle**
- **Most Important**: This is Gann's primary trend line
- **Bullish**: Price above 1x1 = uptrend intact
- **Bearish**: Price below 1x1 = downtrend intact
- **Break**: 1x1 angle break = major trend change
#### **Multi-Angle Confluence Trading**
```
STRONG BULLISH SIGNAL:
✅ Price above 1x1 angle (45°)
✅ Bouncing off 2x1 angle (support)
✅ Volume increasing
✅ Multiple angles pointing up
ENTRY: Buy on 2x1 angle bounce
STOP: Below 1x2 angle
TARGET: Next angle resistance
```
### Strategy 3: Projection Trading (Forming Squares)
#### **Anticipation Strategy**
```
SETUP IDENTIFICATION:
👀 Info table shows "⚡ FORMING" status
👀 Progress bar > 70%
👀 P/T Ratio approaching 1.00
👀 Price approaching projected completion zone
ENTRY PREPARATION:
- Set alerts for projected completion levels
- Prepare for reversal at projection zone
- Watch for volume confirmation
- Monitor momentum indicators
```
## 📈 Step-by-Step Trading Process
### Phase 1: Market Analysis (Before Trading)
1. **Check Market Trend**: Look at info table trend indicator
2. **Identify Active Pivots**: Note last significant high/low
3. **Assess Volatility**: High volatility = larger stops needed
4. **Review Completed Squares**: These become support/resistance zones
### Phase 2: Trade Setup Identification
1. **Monitor Forming Squares**: Watch progress bars in info table
2. **Check Gann Angles**: Are they supporting or opposing your bias?
3. **Confirm with Volume**: Look for volume spikes at key levels
4. **Set Alerts**: Use TradingView alerts for completion zones
### Phase 3: Trade Execution
1. **Wait for Confirmation**: Don't trade on projections alone
2. **Enter on Breakout**: Price breaking square boundaries
3. **Set Stops Immediately**: Use square edges as stop levels
4. **Scale Out**: Take partial profits at angle intersections
### Phase 4: Trade Management
1. **Trail Stops**: Use Gann angles as trailing stop levels
2. **Monitor Progress**: Watch for new square formations
3. **Exit Signals**: New squares in opposite direction
4. **Review Performance**: Analyze win/loss against square accuracy
---
## 🎯 High-Probability Setups
### Setup A: Double Confirmation
```
BULLISH EXAMPLE:
1. Bullish square completes at major support
2. Price bounces off 1x1 Gann angle
3. Volume surge confirms reversal
4. RSI divergence present
PROBABILITY: 75-80%
RISK/REWARD: 1:3 typical
```
### Setup B: Angle Breakout
```
BEARISH EXAMPLE:
1. Price breaks below 1x1 angle
2. Bearish square forming below break
3. Multiple angles now resistance
4. Volume confirms breakdown
PROBABILITY: 70-75%
RISK/REWARD: 1:2.5 typical
```
### Setup C: Time Cycle Convergence
```
REVERSAL EXAMPLE:
1. Square completion at time cycle high/low
2. Multiple Gann angles converging
3. Momentum divergence
4. Volume climax
PROBABILITY: 80-85%
RISK/REWARD: 1:4 possible
```
---
## ⚠️ Risk Management Rules
### Position Sizing
- **Conservative**: 1-2% risk per trade
- **Aggressive**: 2-3% risk per trade
- **Never exceed**: 5% total portfolio risk
### Stop Loss Guidelines
- **Completed Squares**: Opposite edge + 1 ATR
- **Gann Angles**: Below/above angle + 0.5 ATR
- **Projections**: 50% of square height
### Take Profit Targets
- **Target 1**: Next Gann angle (1:1 R/R)
- **Target 2**: Next completed square (1:2 R/R)
- **Target 3**: Major S/R level (1:3 R/R)
---
## 📊 Reading the Info Table for Trading
### Market Trend Section
```
📈 BULLISH → Look for long setups
📉 BEARISH → Look for short setups
➡️ NEUTRAL → Wait for direction
```
### Volatility Status
```
🔥 HIGH → Larger stops needed
⚡ ELEVATED → Normal stops
😴 LOW → Tighter stops possible
📊 NORMAL → Standard approach
```
### Square Progress Monitoring
```
✅ COMPLETED → Ready to trade
⚡ FORMING → Prepare for setup
🔥 ACTIVE → Monitor closely
⏳ WAITING → No immediate action
```
### P/T Ratio Interpretation
```
🎯 Perfect (0.8-1.2) → High probability setup
⚡ Good (0.6-1.4) → Moderate probability
⚠️ Watch (outside range) → Lower probability
```
---
## 🔄 Common Trading Scenarios
### Scenario 1: Trend Continuation
**Setup**: Price pulls back to completed square in uptrend
**Action**: Buy at square support with 1x1 angle confirmation
**Management**: Trail stop below each new square formation
### Scenario 2: Reversal Trading
**Setup**: Multiple squares complete at major S/R
**Action**: Fade the move when price rejects square edges
**Management**: Quick profits, tight stops
### Scenario 3: Breakout Trading
**Setup**: Price consolidates in square, then breaks out
**Action**: Trade breakout direction with volume confirmation
**Management**: Use opposite square edge as stop
---
## 📱 Alert Setup Recommendations
### Critical Alerts
1. **Square Completion**: "Gann Square Completed - Check for reversal"
2. **1x1 Angle Break**: "Master angle broken - Trend change possible"
3. **Projection Reached**: "Forming square at 90% - Prepare for reversal"
4. **Multi-Angle Touch**: "Price at angle confluence - High probability setup"
---
Remember: **Gann analysis is both art and science**. The indicator provides the mathematical framework, but successful trading requires patience, discipline, and continuous learning. Start with small positions while you master the methodology!
在腳本中搜尋"rsi divergence"

Ultimate Regression Channel v5.0 [WhiteStone_Ibrahim]Ultimate Regression Channel v5.0: Comprehensive User Guide
This indicator is designed to visualize the current trend, potential support/resistance levels, and market volatility through a statistical analysis of price action. At its core, it plots a regression line (a trend line) based on prices over a specific period and adds channels based on standard deviation around this line.
1. Core Features and Settings
Length Mode:
Numerical (Manual): You define the number of bars to be used for the regression channel calculation. You can use lower values (e.g., 50-100) for short-term analysis and higher values (e.g., 200-300) to identify long-term trends.
Automatic (Based on Market Structure): This mode automatically draws the channel starting from the highest high or lowest low that has formed within the Auto Scan Period. This allows the indicator to adapt itself to significant market turning points (swing points), which is highly useful.
Regression Model:
Linear: Calculates the trend as a straight line. It generally works well in stable, short-to-medium-term trends.
Logarithmic: Calculates the trend as a curved line. It more accurately reflects price action, especially on long-term charts or for assets that experience exponential growth/decline (like cryptocurrencies or growth stocks).
Channel Widths:
These settings determine how far from the central trend line (in terms of standard deviations) the channels will be drawn.
The 0 (Inner), 1 (Middle), and 2 (Outer) channels represent the "normal" range of price movement and the "extreme" zones. Statistically, about 95% of all price action occurs within the outer channels (2nd standard deviation).
2. Visual Extras and Their Interpretation
Breakout Style:
This feature alerts you when the price closes above the uppermost channel (Channel 2) with a green arrow/background or below the lowermost channel with a red arrow/background.
This is a very important signal. A breakout can signify that the current trend is strengthening and likely to continue (a breakout/trend-following strategy) or that the market has become overextended and may be due for a reversal (an exhaustion/top-bottom signal). It is critical to confirm this signal with other indicators (e.g., RSI, Volume).
Info Label:
This provides an at-a-glance summary of the channel on the right side of the chart:
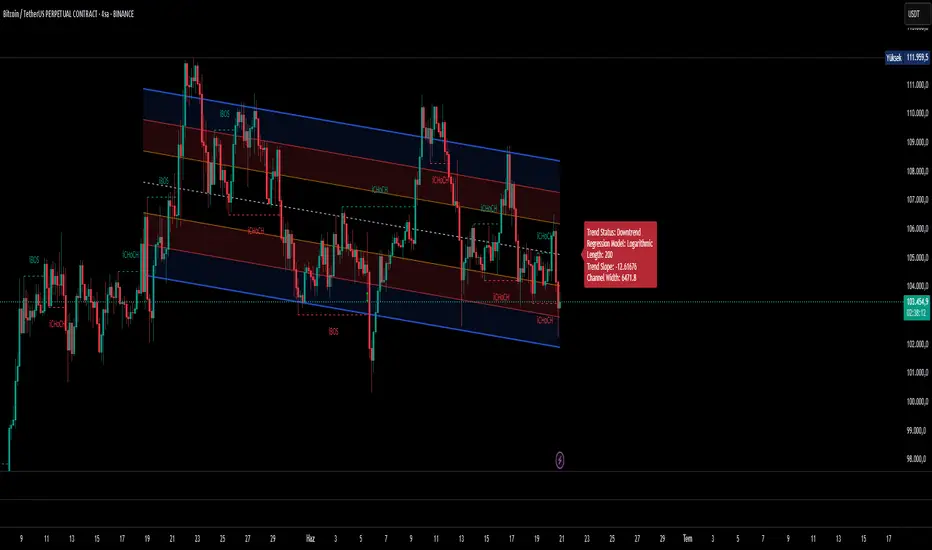
Trend Status: Identifies the trend as "Uptrend," "Downtrend," or "Sideways" based on the slope of the centerline. The Horizontal Threshold setting allows you to filter out noise by treating very small slopes as "Sideways."
Regression Model and Length: Shows your current settings.
Trend Slope: A numerical value representing how steep or weak the trend is.
Channel Width: Shows the price difference between the outermost channels. This is a measure of current volatility. A widening channel indicates increasing volatility, while a narrowing one indicates decreasing volatility.
3. What Users Should Pay Attention To & Best Practices
Define Your Strategy: Mean Reversion or Breakout?
Mean Reversion: If the market is in a ranging or gently trending phase, the price will tend to revert to the centerline after hitting the outer channels (overbought/oversold zones). In this case, the outer channels can be considered opportunities to sell (upper channel) or buy (lower channel).
Breakout: If a strong trend is in place, a price close beyond an outer channel can be a sign that the trend is accelerating. In this scenario, one might consider taking a position in the direction of the breakout. Correctly analyzing the current market state (ranging vs. trending) is key to deciding which strategy to employ.
Don't Use It in Isolation: No indicator is a holy grail. Use the Regression Channel in conjunction with other tools. Confirm signals with RSI divergences for overbought/oversold conditions, Moving Averages for the overall trend direction, or Volume indicators to confirm the strength of a breakout.
Choose the Right Model: On shorter-term charts (e.g., 1-hour, 4-hour), the Linear model is often sufficient. However, on long-term charts like the daily, weekly, or monthly, the Logarithmic model will provide much more accurate results, especially for assets with parabolic movements.
The Power of Automatic Mode: The Automatic length mode is often the most practical choice because it finds the most logical starting point for you. It saves you the trouble of adjusting settings, especially when analyzing different assets or timeframes.
Use the Alerts: If you don't want to miss the moment the price touches a key channel line, set up an alert from the Alert Settings section for your desired line (e.g., only the "Outer Channels"). This helps you catch opportunities even when you are not in front of the screen.
TTM Scalper AlertTTM Scalper Alert — Real-Time Pivot Detector
Description:
This is a custom implementation of the classic TTM Scalper Alert, adapted to show early pivot detection and trend structure tracking in real-time. The script identifies potential highs and lows before the full pivot confirmation—giving traders an early edge—and removes outdated signals once pivots are confirmed.
It supports two levels of detection:
Fast Alert Pivots : Identified after Alert Period candles confirm a local reversal.
Confirmed Pivots : Validated only after Pivot Period candles on both sides ensure a true swing high/low.
How It Works:
Fast Detection (Early Pivots):
Detected after Alert Period (AP) candles. These are provisional signals, shown as triangle labels (▲▼) near current price. Only the latest signal is shown; previous fast pivots are deleted to avoid clutter.
Confirmed Pivots:
Detected with a full lookback of Pivot Period (PP) on both sides of the candle. Shown using plotshape with triangle markers (▲▼). Serve as anchors for price structure analysis (HH-HL or LL-LH tracking).
Custom Source Option:
Users can choose to base pivots on High/Low or Close/Open range. Helps adjust sensitivity depending on volatility or bar structure.
How to Interpret:
Trend & Market Structure:
Use Confirmed Pivots (plotshapes) to analyze market structure:
HH → HL: Uptrend
LL → LH: Downtrend
Watch for breaks in structure for possible reversals
Early Alerts:
The floating labels (▲▼) represent early warnings of a potential pivot. Use them to anticipate:
Short-term exhaustion
Quick scalping entries
Divergence setups
Inputs:
Source : Choose from High/Low or Close/Open — affects how pivots are calculated
Alert Period : How fast the script detects an early reversal pattern (used for entry timing)
Pivot Period : How many candles before/after to confirm a full pivot (used for structural analysis)
Best For:
Traders who follow price action and structure
Scalpers and intraday traders who want early signals
Anyone using pivot highs/lows for confluence with other tools (like RSI divergence, Bollinger Bands, VWAP, etc.)
Pro Tips:
Combine this with:
Trend Magic or Supertrend for directional bias
Volume spike filters to confirm reversal intent
RSI/CCI divergence to strengthen reversal pivots
Adjust Alert Period to tune early signal sensitivity (lower = faster but noisier)

Dual Keltner ChannelsDual Keltner Channels (DKC) Indicator 📊
🔹 About This Indicator
This indicator is an enhanced version of the original Keltner Channel available in TradingView. The Keltner Channel was initially designed as a volatility-based envelope around a moving average, helping traders identify trends, breakouts, and potential reversal zones.
💡 Original Creator: The Keltner Channel concept is based on the work of Chester W. Keltner and was later implemented in various trading platforms, including TradingView’s built-in Keltner Channel indicator.
This script builds upon the TradingView version of the Keltner Channel, adding:
✅ Dual Keltner Bands (Inner & Outer) for better trend and volatility analysis.
✅ Customizable Moving Averages (EMA/SMA) for flexibility.
✅ Multiple Band Calculation Methods (ATR, True Range, Range) for improved accuracy.
✅ Shaded Zones Between the Bands for enhanced visual clarity.
⚡ Credit: This indicator is an enhancement of the original Keltner Channel Indicator in TradingView. All improvements and modifications are made to provide deeper market insights while maintaining the core principles of the original Keltner concept.
🔹 Overview
The Dual Keltner Channels (DKC) indicator overlays two Keltner Channels on the price chart, helping traders spot trends, breakouts, and reversals with greater precision.
Inner Keltner Band (Multiplier 1): Captures normal price movements.
Outer Keltner Band (Multiplier 2): Highlights extreme price movements and potential breakouts.
🔹 Features & Inputs
📌 Main Inputs:
Keltner Channel Length: Defines the lookback period for the moving average calculation.
Source Price: Selects the price type (close, open, high, low) to calculate the bands.
Exponential Moving Average (EMA) Option: Choose between Exponential (EMA) or Simple (SMA) as the basis for calculations.
Bands Style: Selects how the volatility is measured:
Average True Range (ATR) (default)
True Range (TR)
Range (High - Low)
ATR Length: Determines the length of ATR calculations.
Enable Multiplier 1 & 2: Toggle to display/hide inner (multiplier 1) and outer (multiplier 2) bands.
📌 Keltner Channels Calculation:
Moving Average (MA): Uses either EMA or SMA for the midline.
Volatility Band Calculation:
Upper Band 1 (Inner Band): MA + (Multiplier 1 × Volatility Measure)
Lower Band 1 (Inner Band): MA - (Multiplier 1 × Volatility Measure)
Upper Band 2 (Outer Band): MA + (Multiplier 2 × Volatility Measure)
Lower Band 2 (Outer Band): MA - (Multiplier 2 × Volatility Measure)
📌 Visuals & Plotting:
Inner Bands (Multiplier 1): Blue upper & lower lines.
Outer Bands (Multiplier 2): Darker blue upper & lower lines.
Basis Line: White moving average.
Shaded Areas:
Between Upper 1 & Upper 2 (Light Brown Area): Identifies the upper Keltner region.
Between Lower 1 & Lower 2 (Light Brown Area): Identifies the lower Keltner region.
🔹 How to Use the Dual Keltner Channels Indicator
✅ 1. Trend Identification
Price above the upper outer band (Multiplier 2): Strong uptrend – potential continuation.
Price below the lower outer band (Multiplier 2): Strong downtrend – potential continuation.
Price within the inner bands (Multiplier 1): Sideways market – possible consolidation.
✅ 2. Breakout Trading
Break above outer upper band: Indicates a bullish breakout – consider long trades.
Break below outer lower band: Indicates a bearish breakdown – consider short trades.
✅ 3. Overbought & Oversold Conditions
Price touching/exceeding outer bands (Multiplier 2): Potential reversal zones.
Reversal confirmation: Look for candlestick patterns (e.g., Doji, Engulfing) or divergence signals.
✅ 4. Pullback & Entry Zones
Price bouncing from inner bands (Multiplier 1): Good re-entry point in trend direction.
Inner band as support/resistance: Helps in setting stop-loss and profit targets.
🔹 Effective Trading Strategies Using DKC
📌 1. Trend Following Strategy (Using Moving Average & Bands)
✅ Look for price staying above/below the basis line (MA) within the outer bands.
✅ Use pullbacks to the inner bands as re-entry points for trend continuation.
✅ Confirm trend strength with momentum indicators like RSI, MACD.
📌 2. Breakout Trading Strategy
✅ Identify a tight consolidation phase within the inner Keltner bands.
✅ Wait for a strong breakout beyond the outer bands.
✅ Enter long/short trades based on breakout direction.
✅ Place stop-loss at the previous inner band to manage risk.
📌 3. Reversal Strategy (Mean Reversion)
✅ When price extends beyond the outer band (Multiplier 2), look for reversal signals (candlestick patterns, RSI divergence).
✅ Enter counter-trend trades with tight stop-loss beyond the band.
✅ Target the moving average (basis line) as take-profit.
🔹 Final Thoughts 💡
The Dual Keltner Channels (DKC) is a powerful upgrade to the standard Keltner Channel, providing:
✅ Greater clarity on trend strength
✅ More precise breakout & reversal signals
✅ Better visual insights for dynamic market conditions
📌 Best Used With: RSI, MACD, Volume Profile, Price Action Signals.
📌 Works on: Stocks, Forex, Crypto, Commodities, Indices.

DT-DB - waynebrogenzaThis Pine Script™ indicator, DT-DB by waynebrogenza, is designed to help traders identify potential Double Tops (DT) and Double Bottoms (DB) on a price chart. These formations are powerful signals in technical analysis, often indicating reversals or key turning points in the market. Here's how it works and why it could change your trading game:
What It Does:
Detects Reversal Patterns:
Double Tops (DT): These typically signal a bearish reversal, meaning the price might start dropping after forming this pattern.
Double Bottoms (DB): These usually indicate a bullish reversal, suggesting the price could rise after forming this pattern.
Automates Signal Detection:
You don’t need to manually spot these patterns; the script does it for you in real time.
It plots Buy and Sell signals directly on your chart, making it easy to act quickly.
Volume and RSI Filters:
Ensures patterns are confirmed using volume and RSI (Relative Strength Index) divergence for better reliability.
Filters out weak or unreliable signals.
Custom Alerts:
You can set alerts for Buy and Sell signals, so you’re notified whenever an opportunity arises.
Visual Representation:
Highlighted zones (boxes) on the chart help you see where the patterns are forming and how price action evolves.
How It Can Help You:
Clarity in Chaos: Eliminates guesswork and provides clear trading signals, reducing emotional decision-making.
Time-Saving: Automatically scans the market for patterns so you can focus on strategy, not searching.
Confidence Booster: Filters like volume and RSI divergence ensure you’re acting on more reliable signals.
Beginner-Friendly: Even if you're new to trading, this indicator gives straightforward Buy and Sell cues, making it easy to get started.
Why It’s Life-Changing:
Trading can be overwhelming, especially if you’re not sure where to begin. This tool simplifies the process by giving you a structured way to identify profitable opportunities. By focusing on proven chart patterns and integrating confirmation signals, it helps you make better-informed trades and potentially achieve more consistent results.
Use this indicator to gain confidence, save time, and take your trading skills to the next level. Whether you're trading stocks, forex, or crypto, this script could become your new trading companion!

Weekly COTAdjusted COT Index
Improves upon: "COT Index Commercials vs large and small Speculators" by SystematicFutures
How: CoT Indexes are adjusted by Open Interest to normalise data over time, and threshold background colours are in-line with Larry Williams recommendations from his book.
Note: This indicator is **only** accurate on the Daily time-frame due to the mid-week release date for CoT data.
This script calculates and plots the Adjusted Commitment of Traders (COT) Index for Commercial, Large Speculator, and Retail (Small Speculator) categories.
The CoT Index is adjusted by Open Interest to normalise data through time, following the methodology of Larry Williams, providing insights into how these groups are positioned in the market with an arguably more historically accurate context.
COT Categories
-------------------
- Commercials (Producers/Hedgers): Large entities hedging against price changes in the underlying asset.
- Large Speculators (Non-commercials): Professional traders and funds speculating on price movements.
- Retail Traders (Nonreportable/Small Speculators): Small individual traders, typically less informed.
Features
----------
- Open Interest Adjustment
- The net positions for each category are normalized by Open Interest to account
for varying contract sizes.
- Customisable Look-back Period
- You can adjust the number of weeks for the index calculation to control the
historical range used for comparison.
- Thresholds for Extremes
- Upper and lower thresholds (configurable) are provided to mark overbought and
oversold conditions.
- Defaults
- Overbought: <=20
- Oversold: >= 80
- Hide Current Week Option
- Optionally hide the current week's data until market close for more accurate comparison.
- Visual Aids
- Plot the Commercials, Large Speculators, and Retail indexes, and optionally highlight extreme positioning.
Inputs
--------
- weeks
- Number of weeks for historical range comparison.
- upperExtreme and lowerExtreme
- Thresholds to identify overbought/oversold conditions (default 80/20).
- hideCurrentWeek
- Option to hide current week's data until market close.
- markExtremes
- Highlight extremes where any index crosses the upper or lower thresholds.
- Options to display or hide indexes for Commercials, Large Speculators, and Small Speculators.
Outputs
----------
- The script plots the COT Index for each of the three categories and highlights periods of extreme positioning with customisable thresholds.
Usage
-------
- This tool is useful for traders who want to track the positioning of different market participants over time.
- By identifying the extreme positions of Commercials, Large Speculators, and Retail traders, it can give insights into market sentiment and potential reversals.
- Reversals of trend can be confirmed with RSI Divergence (daily), for example
- Continuation can be confirmed with RSI overbought/oversold conditions (daily), and/or hidden RSI Hidden Divergence, for example

Adjusted CoT IndexAdjusted COT Index
Improves upon: "COT Index Commercials vs large and small Speculators" by SystematicFutures
How: CoT Indexes are adjusted by Open Interest to normalise data over time, and threshold background colours are in-line with Larry Williams recommendations from his book.
Note: This indicator is **only** accurate on the Daily time-frame due to the mid-week release date for CoT data.
This script calculates and plots the Adjusted Commitment of Traders (COT) Index for Commercial, Large Speculator, and Retail (Small Speculator) categories.
The CoT Index is adjusted by Open Interest to normalise data through time, following the methodology of Larry Williams, providing insights into how these groups are positioned in the market with an arguably more historically accurate context.
COT Categories
-------------------
- Commercials (Producers/Hedgers): Large entities hedging against price changes in the underlying asset.
- Large Speculators (Non-commercials): Professional traders and funds speculating on price movements.
- Retail Traders (Nonreportable/Small Speculators): Small individual traders, typically less informed.
Features
----------
- Open Interest Adjustment
- The net positions for each category are normalized by Open Interest to account
for varying contract sizes.
- Customisable Look-back Period
- You can adjust the number of weeks for the index calculation to control the
historical range used for comparison.
- Thresholds for Extremes
- Upper and lower thresholds (configurable) are provided to mark overbought and
oversold conditions.
- Defaults
- Overbought: <=20
- Oversold: >= 80
- Hide Current Week Option
- Optionally hide the current week's data until market close for more accurate comparison.
- Visual Aids
- Plot the Commercials, Large Speculators, and Retail indexes, and optionally highlight extreme positioning.
Inputs
--------
- weeks
- Number of weeks for historical range comparison.
- upperExtreme and lowerExtreme
- Thresholds to identify overbought/oversold conditions (default 80/20).
- hideCurrentWeek
- Option to hide current week's data until market close.
- markExtremes
- Highlight extremes where any index crosses the upper or lower thresholds.
- Options to display or hide indexes for Commercials, Large Speculators, and Small Speculators.
Outputs
----------
- The script plots the COT Index for each of the three categories and highlights periods of extreme positioning with customisable thresholds.
Usage
-------
- This tool is useful for traders who want to track the positioning of different market participants over time.
- By identifying the extreme positions of Commercials, Large Speculators, and Retail traders, it can give insights into market sentiment and potential reversals.
- Reversals of trend can be confirmed with RSI Divergence (daily), for example
- Continuation can be confirmed with RSI overbought/oversold conditions (daily), and/or hidden RSI Hidden Divergence, for example


Ultimate RSI - Divergence + S/R + Reverse RSIThis is a modification of the TradingView RSI with some of my favourite RSI features added.
This includes Divergence indicators. EMA with colour change on cross, Support and resistance lines and reverse RSI.
A reverse calc has also been added. This will allow you to input 3 different RSI values for a price prediction. This is good to use with the support and resistance lines and can give you key areas on the chart where the price may bounce/reject.
All colours and modifications can be turned on/off.
Enjoy! :)

Day Trade Indicator [by KN Lo]Design for LONG and Day Trade only
=============================
features (this indicator is able to):
- show EMA 9, 50, 200 & VWAP
- show Candle Pattern (e.g. Engulfing, Shooting Star)
- show HMA fast(10) / slow(50) lines
- show Breakout Signal (Blue triangle)
- show RSI Divergence
- find Volitility Decreasing
- find Consolidation stage
- change Background color (green) when positive figures
- show indicator table
=============================
indicator table:
- Price over VWAP
- Price over EMA200
- EMA9 > EMA50 > EMA200
- RSI < 80
- EMA9 > VWAP
- MACD fast > slow
- HMA fast > slow
- RSI Divergence (compare with previous higher high)
- Breakout Signal when the price is higher than previous high
- Volitility: the difference between previous high (9 periods) and previous low (9 periods), average by SMA, if lower than -30, show in green color.
- Consolidation: consider previous 7 periods to find consolidation stage.

Reversal scoreDynamic divergence indicator on 3 indicators, without delays or repaints
Technological choices have been made so as not to lie to you about the signals, and so that the backtesting is perfectly faithful to reality. The market is analyzed and looks for a dynamic status of divergence on the Fisher transformation, the Money Flow Index and the MACD: if the status is "divergence", it is quantified by a divergence score to assess its potential and whose parameters are multiple (including market structure during divergence status).
At the top Reversal score, at the bottom the divergence indicator integrated in Tradingview. On this last candle, there will indeed be an RSI divergence but which will only be displayed 5 candles later, where ASTRE displays it to you in real time:
You will notice how certain spikes trigger sharp divergence – an anomaly between the movement of the price and that of the indicators is a good sign of an instant reversal, and in m2, a way to take a 2:1 TP in seconds:
Usage tip: Follow the signals in the direction of the main trend! They are much less numerous but very effective! :
TENKAN BOLTTENKAN BOLT
7 major point in this indicator are as follows :-
•Tenkan-sen
•Ichimoku Cloud
•Exponential Moving Average
•Change of Volume Analysis (calculated in background)
•Modified Keltner Channel (calculated in background)
•RSI Divergence (calculated in background)
•Entry and Exit Point
www.tradingview.com
There will be 2 types of Long entry alert and 2 types of Short entry alert.
•The first one is marked as "Long" or "Short" only which indicates the signal calculated by Keltner Channel, Tenkan-sen and change of volume in sudden time.
•The second one is marked as "Long Divergence" and "Short Divergence" which indicates signal by RSI Divergence in my own way (not aggressive).
The idea of this script is only trade the highest probability setup and I shall call it the "High Probability, Probability Trading". This is definitely not a buy or sell call as the idea of the script is to give a good direction for trader and to learn the high probability trading setup which includes the volatility of the market.
This script specifically created for Futures Crude Palm OIL (FCPO) market and may works differently in different market. It works great in 1 minute time-frame and 3 minute time-frame
(with slight adjustment).
Kindly contact me for usage. Thanks!

[JL] Stochastic Divergence AlertCompare two cross area:
k is increasing, low is lower and previous k is less than bottom level then it is bottom divergence
k is decrease, high is higher and previous k is more than top level then it is top divergence
With long term moving average(400), seems that Stochastic Divergence is more accurate than RSI Divergence on 1m chart.

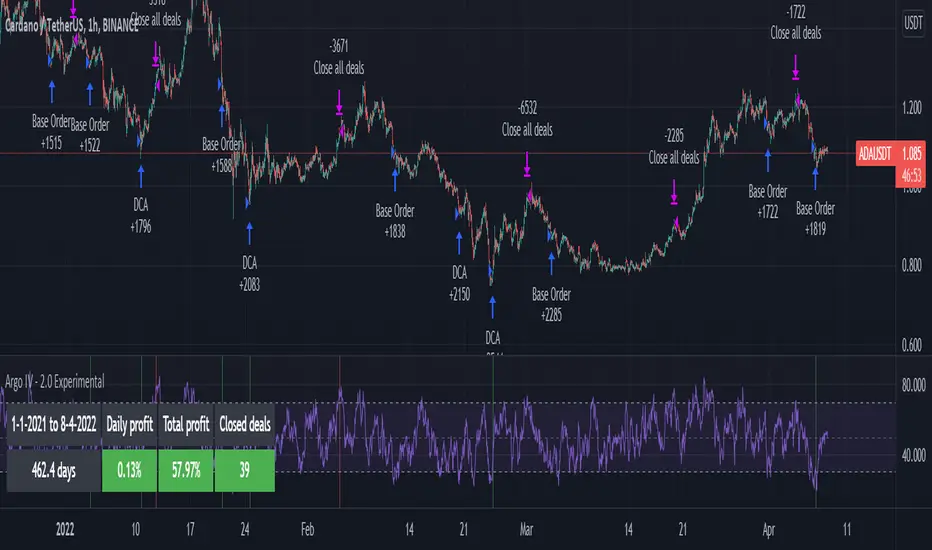
Argo IV - EXPERIMENTAL strategy for 3commas with alertsThis strategy lets users create BUY/SELL alerts for 3commas single bots in a simple way, based on a built in set of indicators that can be tweaked to work together or separately through the study settings. Indicators include Bollinger Bands , Williams %R , RSI , EMA , SMA , Market Cipher, Inverse Fisher Transform, RSI divergence.
It is based on the ARGO I study ( here ), with the following major differences:
- It uses pyramiding (see strategy "properties")
- It includes a lot of new options for deal start/close conditions for maximum control
- It doesn't require any external tool to backtest.
If the user choses to create both BUY and SELL signals from the study settings, the alert created will send both BUY and SELL signals for the selected pair. Note the script will only send alerts for the pair selected in the study settings, not for the current chart (if different).
Important : it is only an early experiment, I will only release the script when satisfied with performance. Until then, I advise not to use this for any real trading.
How to use:
- Add the script to the current chart
- Open the strategy settings , insert bot details. Pairs MUST be in capital letters or 3commas will not recognize them.
- Still in the settings, tweak the deal start/close conditions from various indicators until happy. The strategy will plot the entry / exit points on the chart
- When happy, right click on the "..." next to the study name, then "Add alert'".
- Under "Condition", on the second line, chose "Any alert () function call". Add the webhook from 3commas, give it a name, and "create".
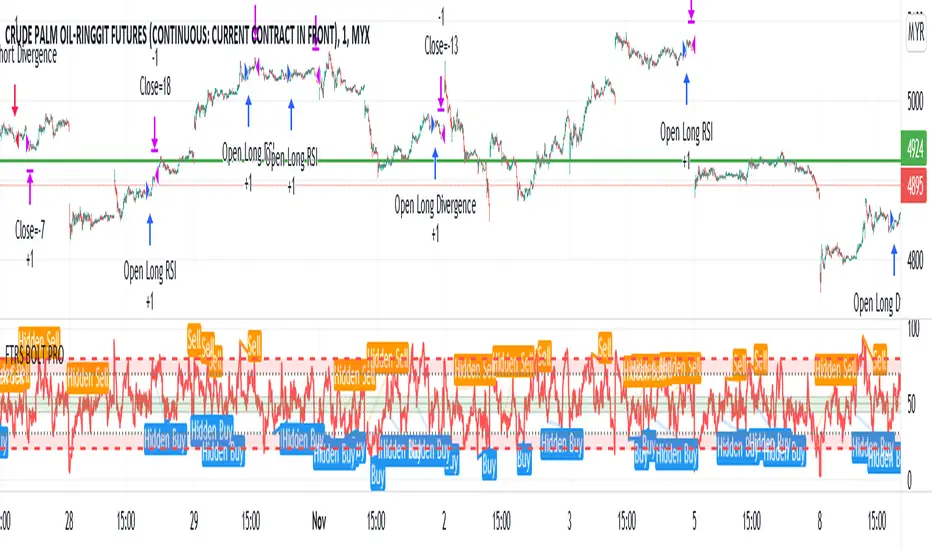
FTRS BOLT PRO
The script uses RSI as major trend identification and supported by RSI divergence for take profit, and also counter trend in certain cases.
Uses EMA 200 for major trend identification to filter false signals, Average Volume as confirmation and faster signal detection to the change of trend.
The indicator detects immediate change of trend and immediately opens position for the major trend.
User can enjoy the RSI with labels of divergence to do manual judgement.
Existing risk to reward ratio based on amount of money instead of ticks count. The currency is depending on the chart's trading currency.
This strategy mainly built for FCPO and its for 1 min settings only. User can toggle the sessions as per users preferences
The default risk to reward ratio is 1:1.5. However, there is a risk management using RSI levels to
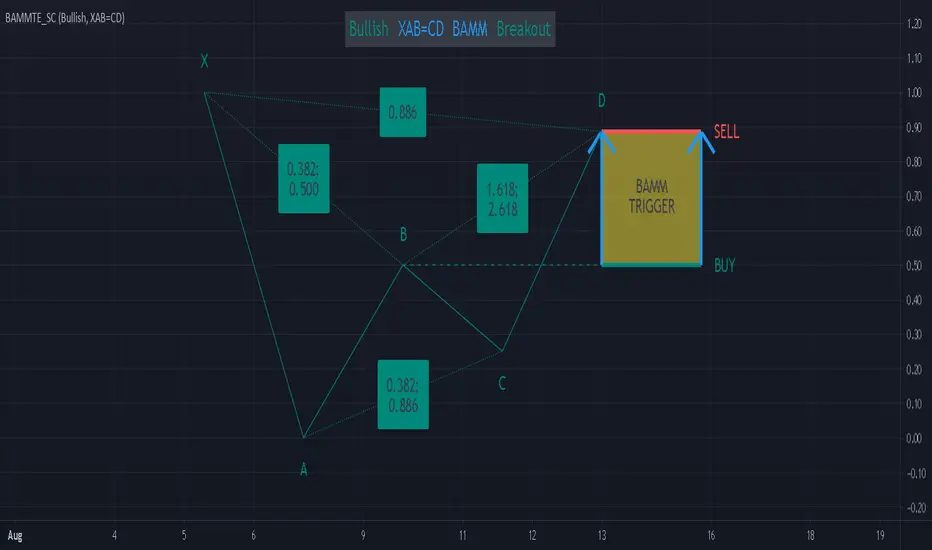
Bat Action Magnet Move BAMM Theory Educational (Source Code)This indicator was intended as educational purpose only for BAMM, which also known as Bat Action Magnet Move.
Indikator ini bertujuan sebagai pendidikan sahaja untuk BAMM, juga dikenali sebagai Bat Action Magnet Move.
BAMM is usually used for Harmonic Patterns such as XAB=CD (Bat Pattern) and AB=CD (0.5 AB=CD Pattern) - Chapter 5.
BAMM also can be used for other Harmonic Pattern with the help of RSI Divergence, hence become RSI BAMM - Chapter 6.
BAMM kebiasaanya digunakan untuk Harmonic Pattern seperti XAB=CD (Bat Pattern) dan AB=CD (0.5 AB=CD Pattern) - Chapter 5.
BAMM juga boleh digunakan untuk Harmonic Pattern lain dengan bantuan RSI Divergence, menjadi RSI BAMM - Chapter 6.
FAQ
1. Credits / Kredit
Scott M Carney,
Scott M Carney, Harmonic Trading: Volume Two (Chapter 5 & Chapter 6)
Bullish XAB=CD BAMM Breakout - Page 144
Bearish XAB=CD BAMM Breakdown - Page 148
Bullish AB=CD BAMM Breakout - Page 153
Bearish AB=CD BAMM Breakdown - Page 156
2. Code Usage / Penggunaan Kod
Free to use for personal usage but credits are most welcomed especially for credits to Scott M Carney.
Bebas untuk kegunaan peribadi tetapi kredit adalah amat dialu-alukan terutamanya kredit kepada Scott M Carney.
2.0 AB=CD Pattern
XAB=CD Bat Pattern
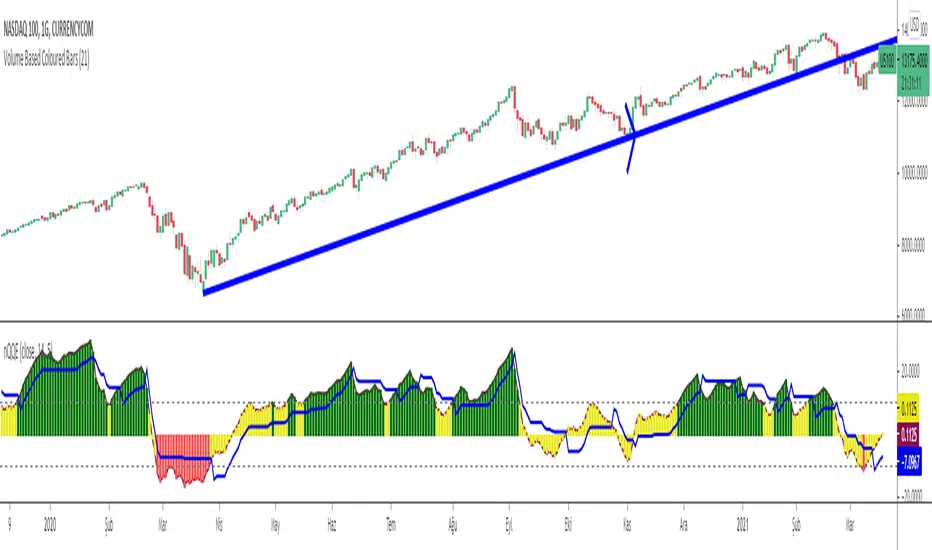
Normalized Quantitative Qualitative Estimation nQQENormalized version of Quantitative Qualitative Estimation QQE:
Normalized QQE tries to overcome the problems of false signals due to RSI divergences on the original QQE indicator.
The main purpose is to determine and ride the trend as far as possible.
So users can identify:
UPTREND : when nQQE Histogram is GREEN (nQQE is above 10)
DOWNTREND : when nQQE Histogram is RED (nQQE is below -10)
SIDEWAYS: when nQQE Histogram is YELLOW (nQQE is between -10 and 10)
Calculation is very simple;
RSI based QQE oscillates between 0-100
nQQE is simply calculated as:
nQQE=QQE-50
to make the indicator fluctuate around 0 level to get more accurate signals.
Various alarms added.
Kıvanç Özbilgiç
PpSignal RSI MTF 3.19This Rsi oscillator have a donichian channel en middle move average included.
have got a QQE or atr move average.
Show new high and new low according to the pivot point.
Show Rsi divergence.
MTF option.

Cyatophilum Ultimate Trading Bot [ALERTSETUP]Private Indicator.
This is an indicator for trading low timeframes . It is generic and configurable meaning you can use it not only on crypto, but also forex, CFD, stocks etc.
HOW IT WORKS
The user chooses between three powerful base strategies: Bollinger Bands + Stoch RSI, RSI Divergences or the SARMA Strategy .
He can also trade support and resistance breakouts , with or without the base strategy.
Use the Alert Setup version to trigger entry and exit alerts .
You can choose between a set of trend lines that will filter trades that are against the main trend in order to increase profitability.
The integrated Trailing Stop Loss will trigger an alert to exit the trade.
You can use the Trailing Take Profit with a configurable % deviation. It will also trigger an exit alert.
SAMPLE USE CASES
XBTUSD 5m BitMEX
XBTUSD 15m BitMEX
ETHUSD 5m BitMEX
ETHUSD 15m BitMEX
USD/WTI 1m IDC (Us Dollar/ WTI Crude OIL)
Backtest below for BITMEX:LTCZ19 in 15m timeframe.
Note: This is the Alert version. You can find the backtest version in my profile.
To get access to the indicator, use the link below, thanks for reading!

Cyatophilum Ultimate Trading Bot [BACKTEST]Private Indicator.
This is an indicator for trading low timeframes . It is generic and configurable meaning you can use it not only on crypto, but also forex, CFD, stocks etc.
HOW IT WORKS
The user chooses between three powerful base strategies: Bollinger Bands + Stoch RSI, RSI Divergences or the SARMA Strategy .
He can also trade support and resistance breakouts , with or without the base strategy.
Use the Alert Setup version to trigger entry and exit alerts .
You can choose between a set of trend lines that will filter trades that are against the main trend in order to increase profitability.
The integrated Trailing Stop Loss will trigger an alert to exit the trade.
You can use the Trailing Take Profit with a configurable % deviation. It will also trigger an exit alert.
SAMPLE USE CASES
XBTUSD 5m BitMEX
XBTUSD 15m BitMEX
ETHUSD 5m BitMEX
ETHUSD 15m BitMEX
USD/WTI 1m IDC (Us Dollar/ WTI Crude OIL)
Backtest below for BITMEX:LTCZ19 in 15m timeframe.
To get access to the indicator, use the link below, thanks for reading!


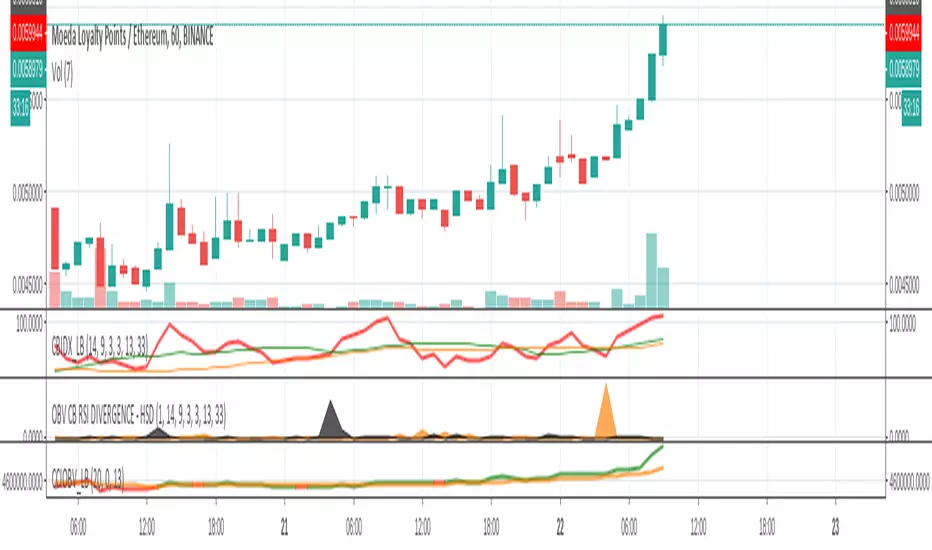
OBV CB RSI DIVERGENCE - HSDShows divergence spikes between OBV and Constance Brown RSI
Trade in the direction of the obv trend when it spikes
Includes LazyBear code and A&E's help - very much appreciated
Useful for all markets n instruments, i guess
Atraxa V2Looking for:
X - Momentum divergence
Y - RSI Divergence
Z - Stochastic oversold/overbought region
Filter some signals with cmf 0.15%
Each overlap prints different combination example...
XY - Momentum + RSI
YZ - RSI + Stochastic